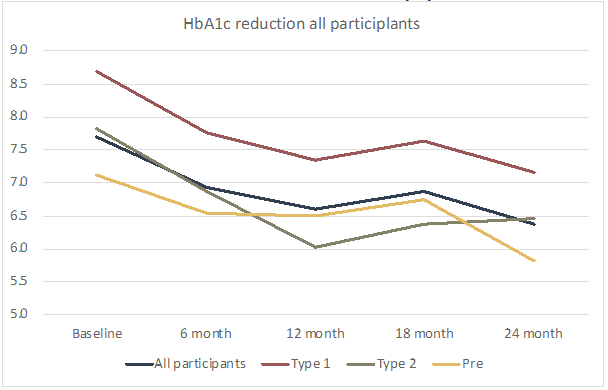
Graph 2:
HbA1c change over 24 months by type of diabetes.