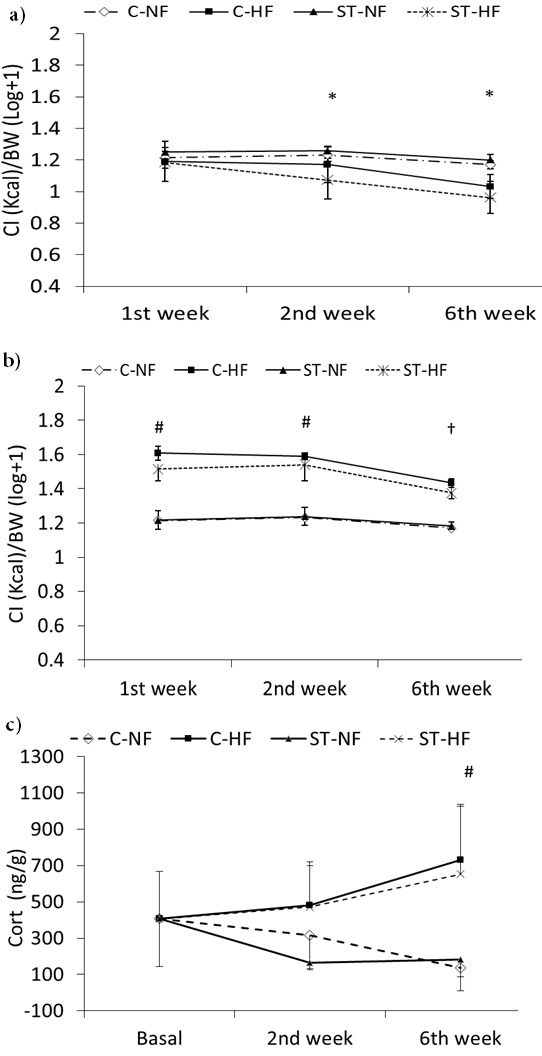
Figure 1: The effect of social-stress and high-fat diet on stress response markers. Caloric intake of standard laboratory chow (a) Standard Laboratory Chow + fat food (bacon) (b) normalized by body weight (CI/ BW) assessed at first, second and sixth weeks of experiment. (c) Fecal corticosterone metabolites (CORT) were measured before experimental protocol, and the follow second and sixth weeks. . Values are represented as mean ± SD obtained from 6 rats in each group. Control with normal (C-NF) and with high fat food (C-HF); stress treatment with normal (STNF) and high fat food (ST-HF). *P<0.05 ST-HF vs. C-NF and ST-NF # P< 0.05 ST-HF and C-HF vs. C-NF and ST-NF, † C-HF vs. C-NF and ST-NF.