Figure 5: The effect of high glucose (HG, 15 mmol/l) on MyoD in mouse C2C12 myoblasts. 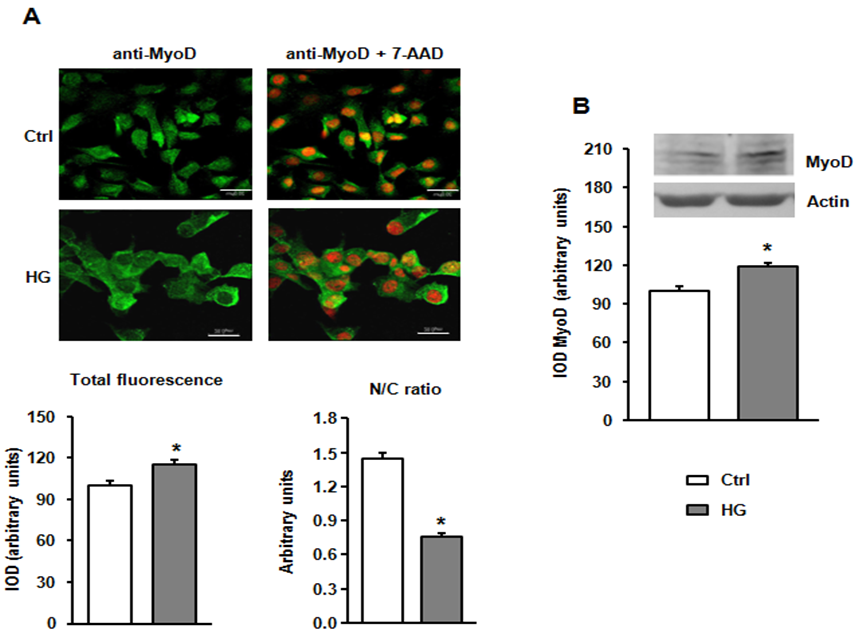
A) The cellular content and the localization of MyoD in cells proliferating for 24 h assessed by confocal microscopy. The images are representative of three separate experiments. Bar, 20μm. The integrated optical density (IOD) obtained in control (Ctrl) cells was set as 100%, and a nucleus/cytoplasm (N/C) ratio was calculated. The data are presented as means ± SE, with n=10/treatment conditions.
B) The levels of MyoD in myoblasts proliferating for 24 h evaluated by immunoblotting. The actin level as a loading control was presented. The means ± SE, with n=9/treatment conditions, and representative blots are shown. * - significantly different vs control value.