Figure 2: The effect of high glucose (HG, 15 mmol/l) on cyclin B1 (CycB1) in mouse C2C12 myoblasts. 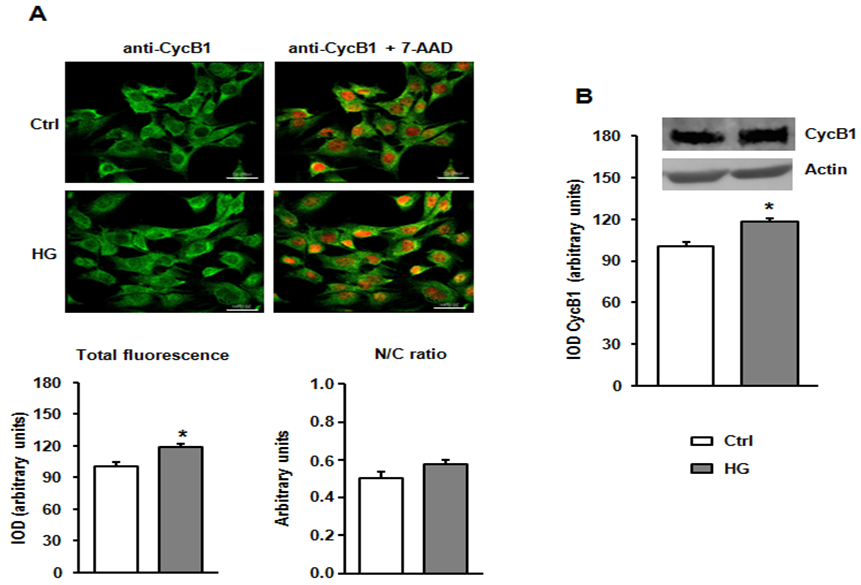
A) The cellular content and the localization of cyclin B1 assessed by confocal microscopy. The images are representative of three separate experiments. Bar, 20μm. The integrated optical density (IOD) obtained in control (Ctrl) cells was set as 100%, and a nucleus/cytoplasm (N/C) ratio was calculated. The data are presented as means ± SE, with n=10/treatment conditions.
B) The levels of CycB1 in myoblasts proliferating for 24 h evaluated by immunoblotting. The actin level as a loading control was presented. The means ± SE, with n=9/treatment conditions, and representative blots are shown. * - significantly different vs control value.