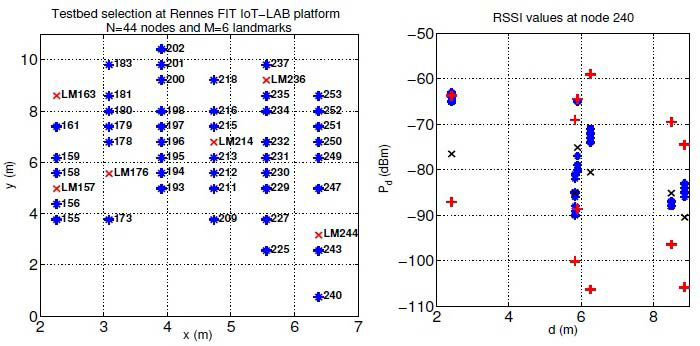
Figure 2: Testbed at FIT IoT-LAB platform (left) and RSSI values (right) collected at node 158 and node 183 from the 6 landmarks. The marker (*) highlights the real RSSI values. The markers (5) and (+) indicate, respectively, the average and the minimum and maximum values from 100 i.i.d. random samples drawn when considering the theoretical LNSM in (1) given the estimated parameters in Table 1.