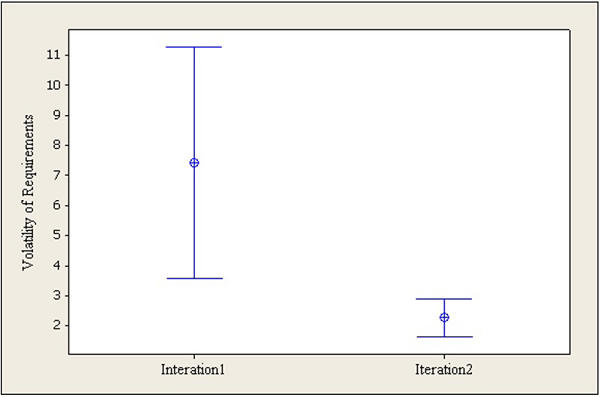
Figure 1:
Interval plot: Volatility of requirements for Iterations 1 and 2.