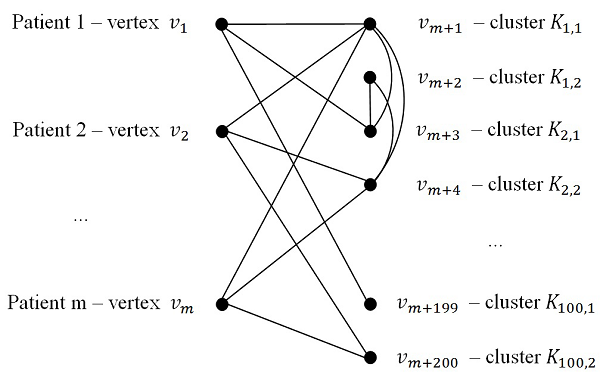
Figure 2:
Graph
G=(V,E)
of CSBG with vertices
V={v
1
,v
2
,…,v
(m+200)
}
representing m patients and 200 clusters of the clusterings K
1
={K
1,1
,K
1,2
}, K
2
={K
2,1
,K
2,2
}, ... , K
100
={K
100,1
,K
100,2
}.