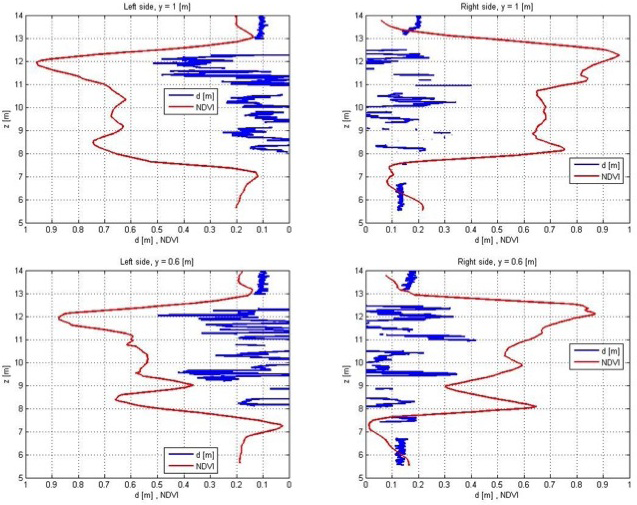
Figure 7:
Plot of the vegetative thicknes along the z coordinate for y=1 and y = 0.6.