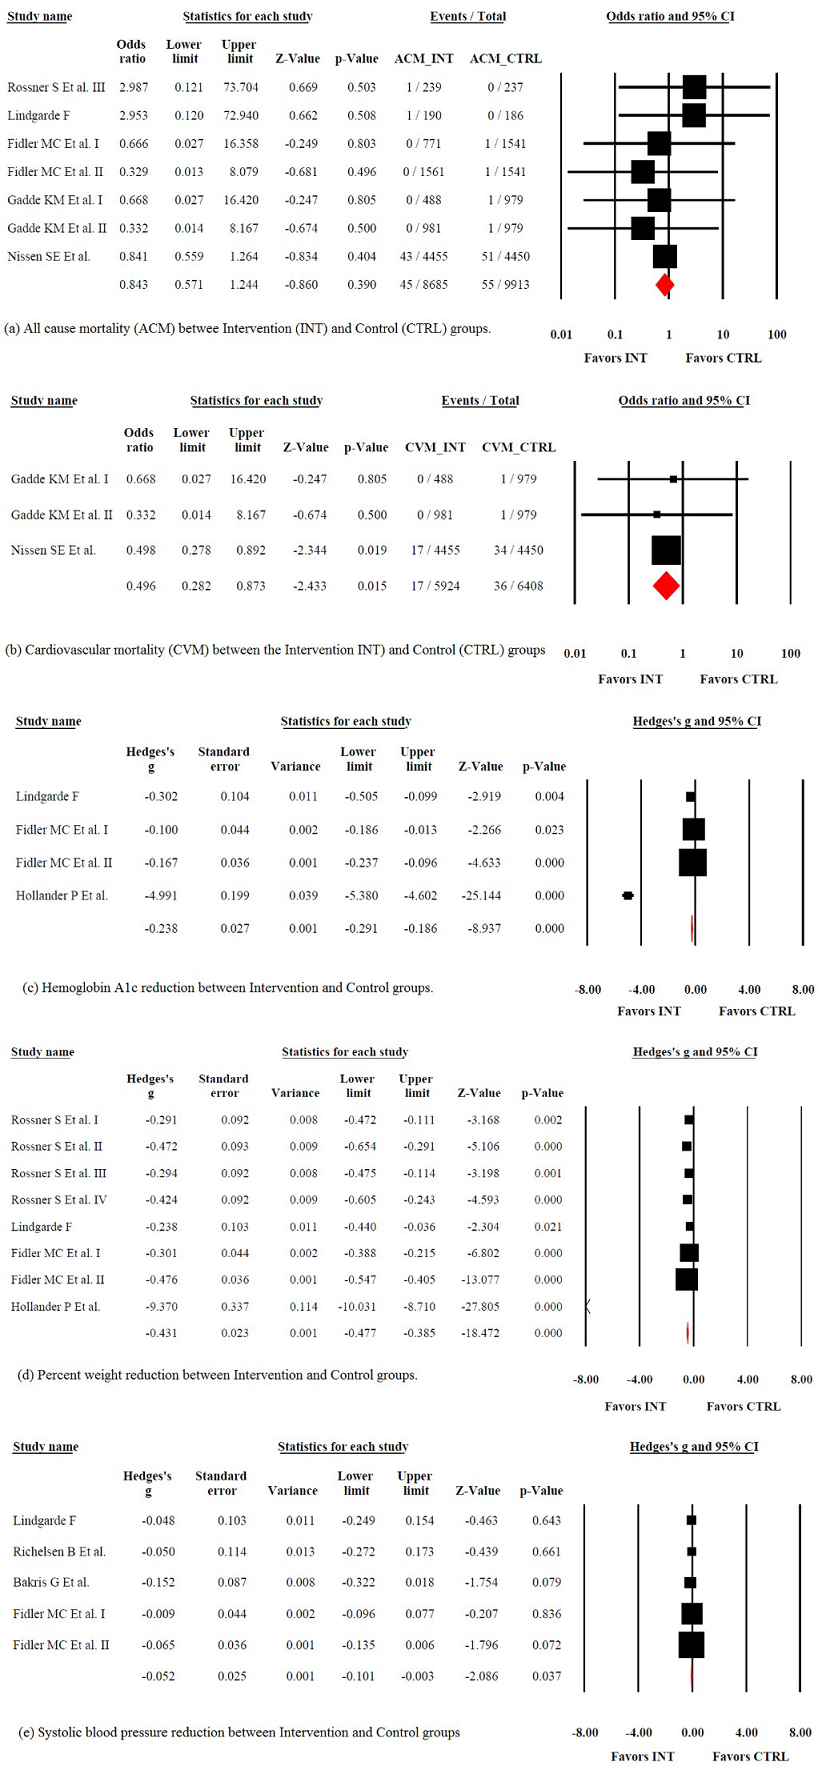
Figure 2:
The figure depicts the comparisions between intervention and control groups using odds ratio for ACM (a) CVM (b) and Hedges's for A1c (c), WT% (d) and SBP (e).