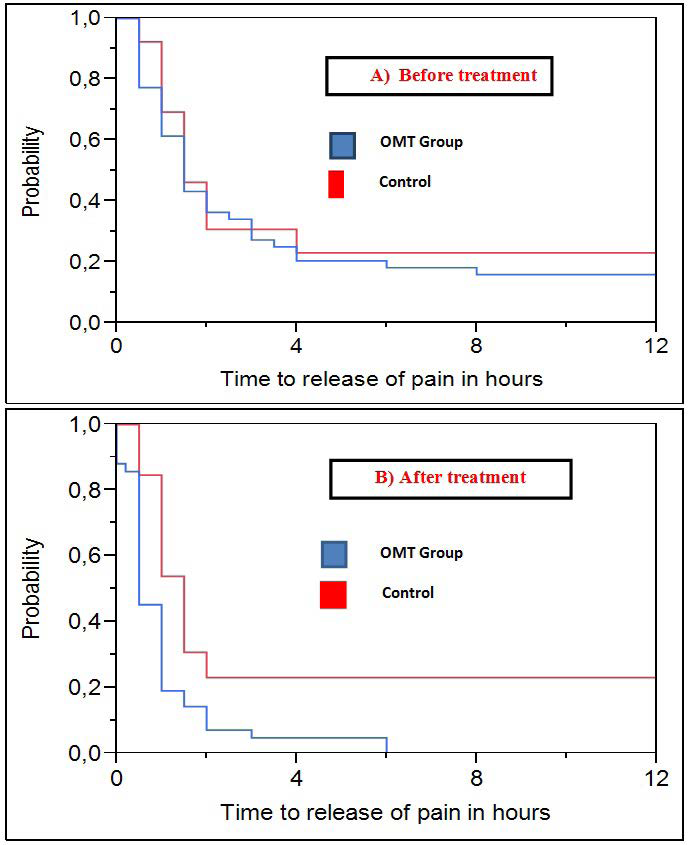
Figure 2: Comparison of time to release of symptoms A) before treatment and B) 1 week after treatment expressed in Kaplan-Meir plot. The probability of symptom release in the OMT group is shown with a blue line; the control group is indicated with a red line.