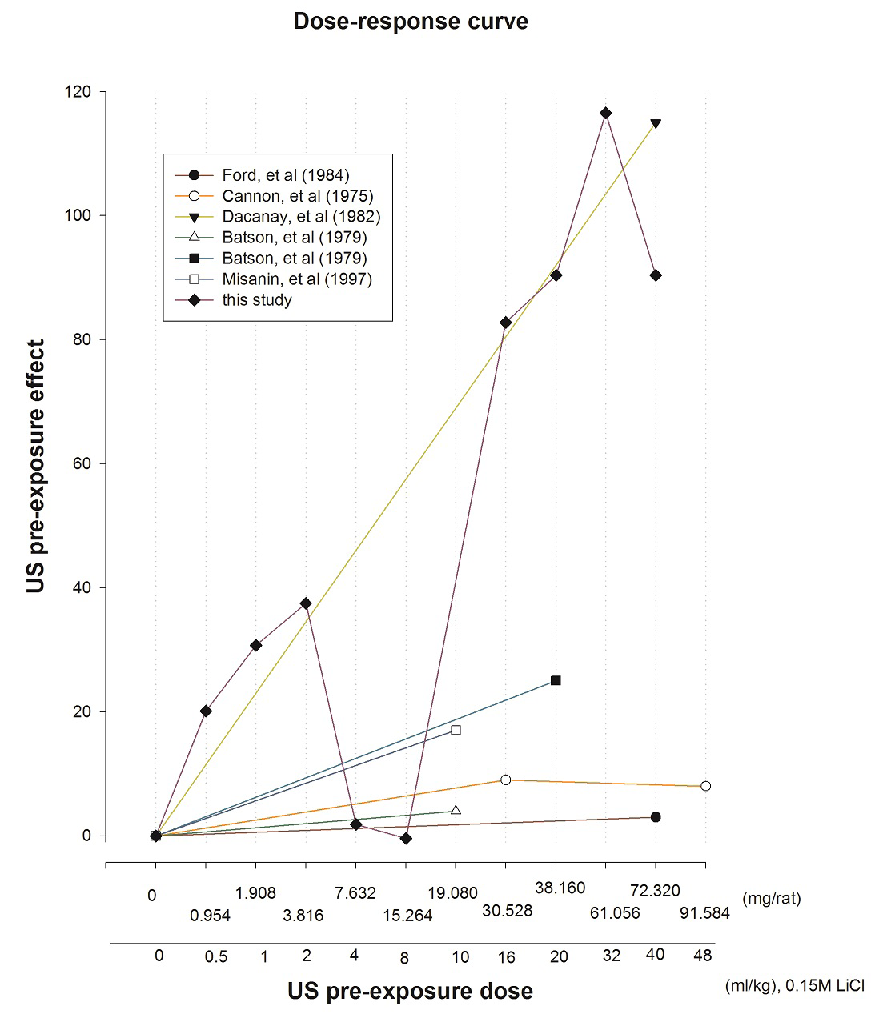
Figure 4: A general comparison of the dose-response relation between US pre-exposure and the effect on CTA of many studies. Note: The stronger the attenuation on CTA relative to the baseline the more the pre-exposure effect. Rat’s average weight was assumed to be 300 gram in all experiments to facilitate comparison.