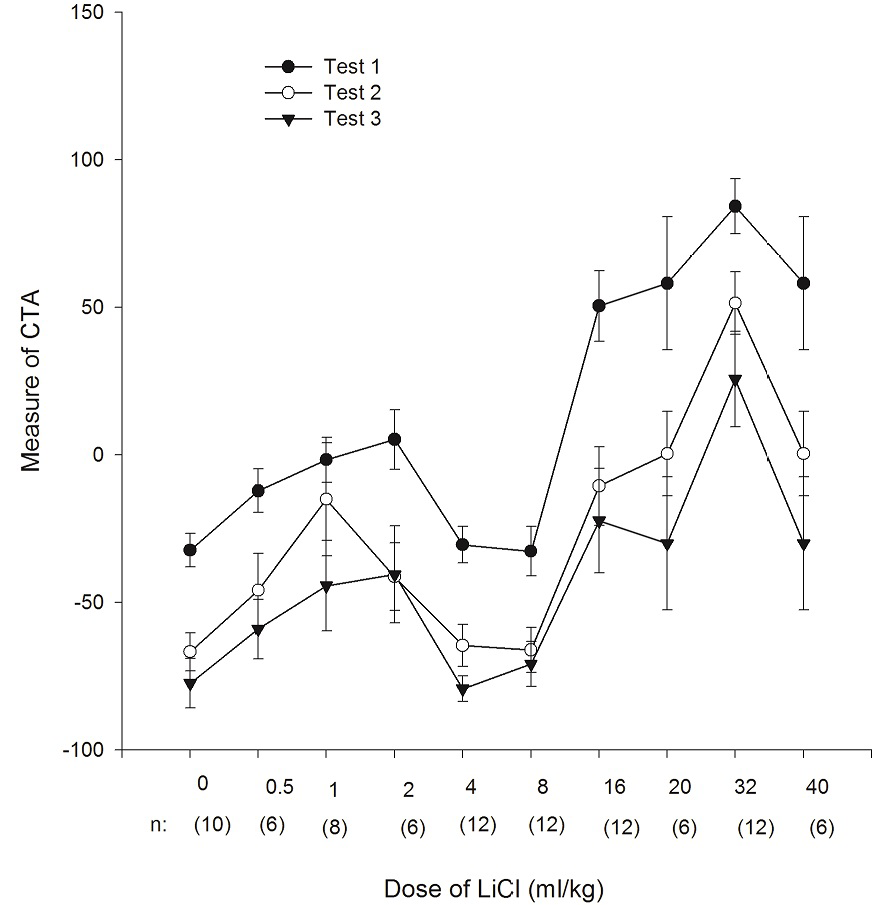
Figure 2: The dose-response relation between US pre-exposure and CTA. Note: Test 1 was a CTA test after one conditioning trial. Test 2 was a CTA test after 2 trials, and Test 3 was a CTA test after 3 trials. “n” indicates the number of subjects used to obtain each mean value.