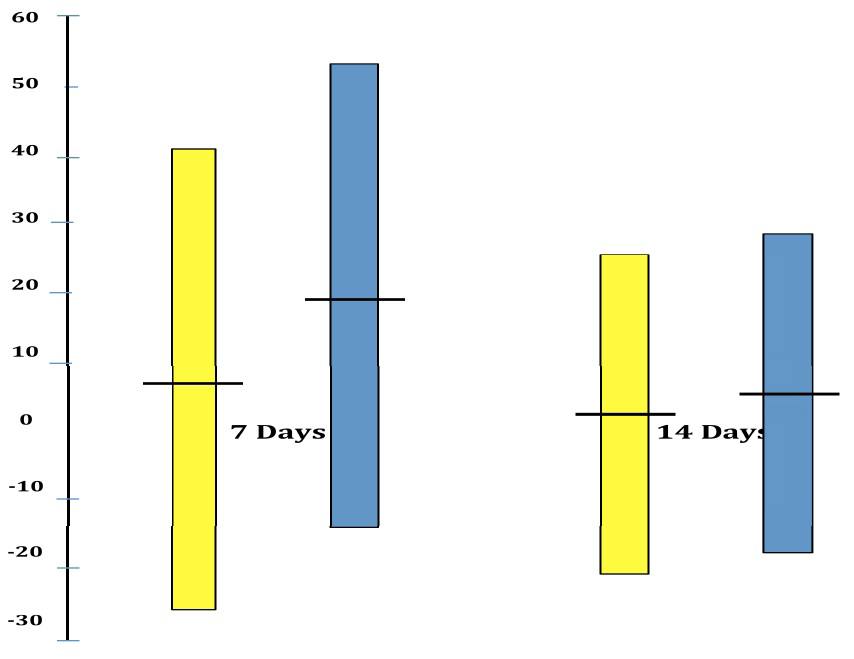
Figure 3: Reductions in Oswestry scores from baseline to two weeks post- treatment. The results are expressed as the mean values (horizontal line) with the 95 % confidence intervals (bars). The two treatments are indicated as yellow colour and the four treatments are indicated as blue colour.