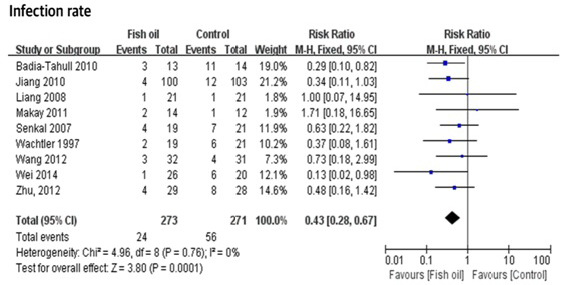
Figure 2:
Forest plot of risk ratios for infection complications rate.
CI: Confidence interval; M-H: Mantel-Haenszel.