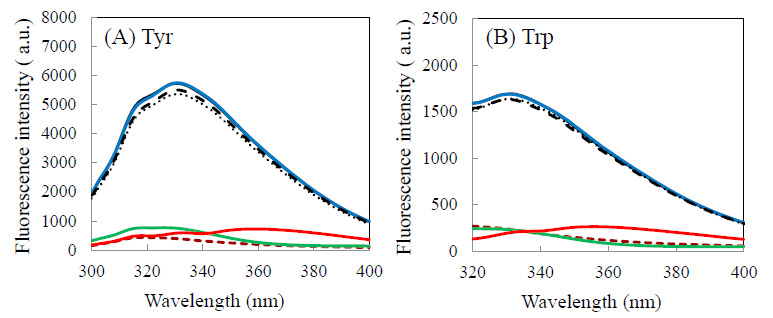
Figure 2: Tyr-excited (A) and Trp-excited (B) fluorescence spectra of cLA in the presence of hydrophobic molecules. By adding each reagent (final 100 μM) to cLA, Tyr-excited fluorescence spectra were measured as described in the text. Graph legends: Black line, buffer; Blue line, MeOH, Black dashed line; stearic acid, Black dotted line; oleic acid, Red line; retinol, Green line; quercetin, Brown dashed line; 8-ANS.