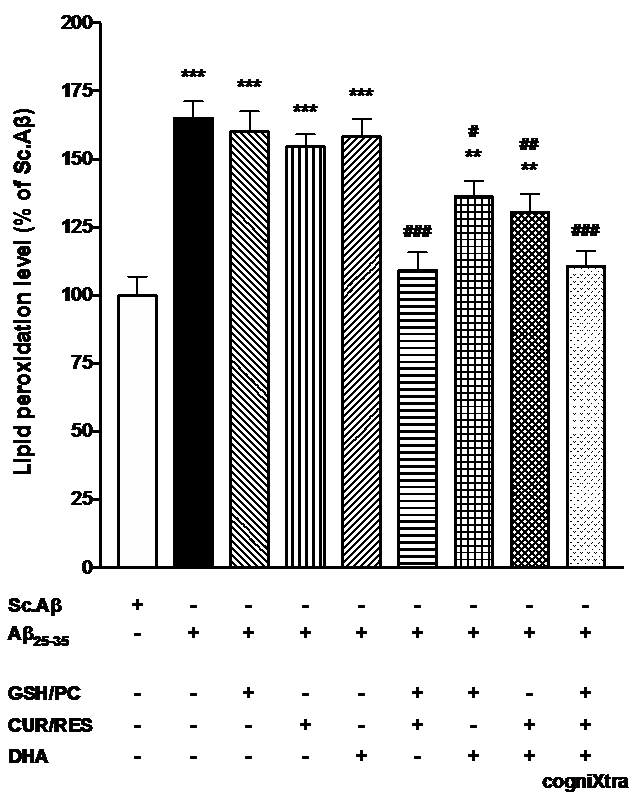
Figure 4: Effect of GSH/PC, CUR/RES, DHA treatments and various combinations on Aβ25-35 oligomeric peptide induced elevation of LPO in the hippocampus. n=6; ** p < 0.01, *** p < 0.001 vs. the Sc.Aβ group, # p < 0.05, ## p < 0.01 ### p < 0.001 vs. the Aβ25-35 group; Dunnett's test.