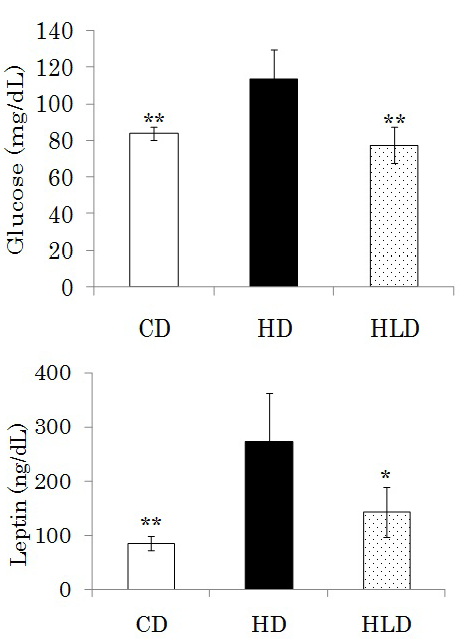
Figure 1: Plasma glucose and leptin concentration in mice fed the experimental diets for 10 weeks.
CD, control diet; HD, high-fat diet; HLD, Lb. paracasei in a high-fat diet. Values represent means ± SDs, n=6. *p<0.05 and **p<0.01.
CD, control diet; HD, high-fat diet; HLD, Lb. paracasei in a high-fat diet. Values represent means ± SDs, n=6. *p<0.05 and **p<0.01.