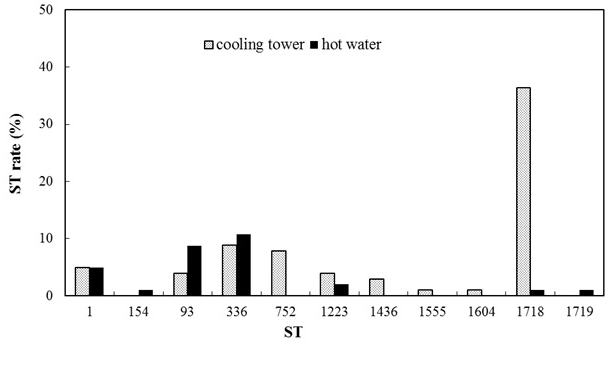
Figure 4:
Comparison of ST profiles of Isolates from cooling tower water (n=72) and hot water (n= 30).