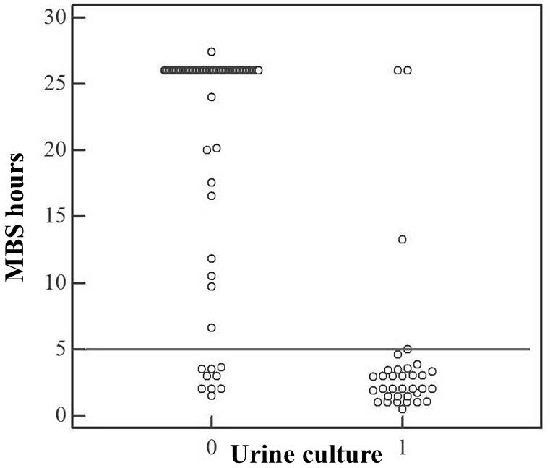
Figure 4:
Dot plot of the MBS POCT. Distribution of true positive (1) and true negative (0) results. MBS hours stand for the time taken for the vials to change color. The cut-off limit of 5 hours is shown as a straight line.