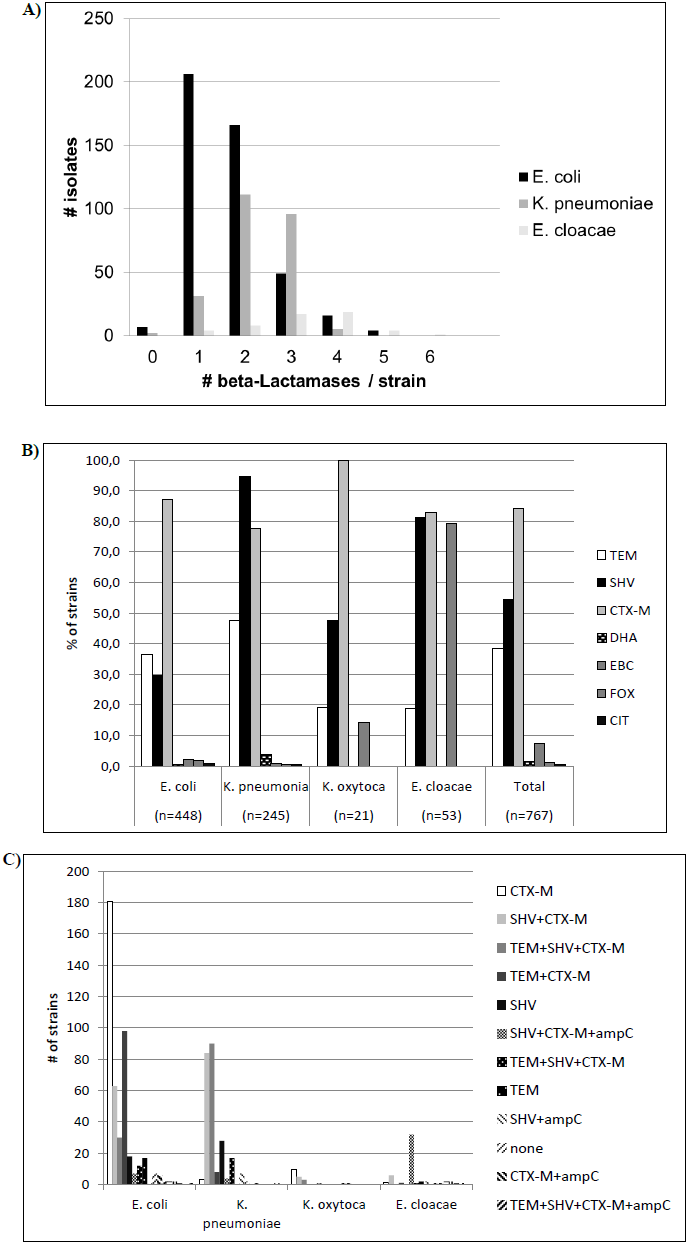
Figure 2: (A) Number of different beta-Lactamases in individual isolates, by bacterial species.
X-axis: number of beta-Lactamase genes detected per individual strain in the given species; Y-axis: number of isolates.
(B) Frequency of ESBL and ampC genes in four different species of Enterobacteriaceae.
y-axis: percent of strains of the respective species, number of strains given in brackets.
(C) Co-occurrences of ESBL and ampC genes in four species of Enterobacteriaceae.
y-axis gives the number of strains, while combinations of beta-lactamase genes are indicated in the legend.